
Refractive index gratings can be created in photorefractive media via an intensity distribution built by interference of two waves. The strength or modulation of such a grating is influenced by the intensity of the writing beams, by their absolute intensity as well as by their intensity ratio.
The theory yields to following expression for the space charge
field Esc that is created inside the medium:

The most important points of this equation are that Esc
is direct proportional to the modulation m (visibility) of the
intensity distribution (valid for m<<1) and that Esc
does not depend on the absolute intensity Iabs. The
diffraction efficiency h at the grating
can be derived from

to be proportional to m2.
The relations h=f(m) and
Dn=f(m) should be verified first. For this purpose
the experimental arrangement shown in Fig.1 was used.
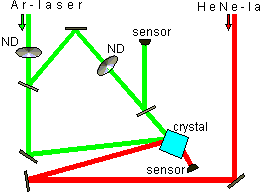
Figure 1: Experimental arrangement
The grating is written by two beams with intensities I1 and I2 of an Ar-laser where the absolute intensity (Iabs=I1+I2) as well as the intensity ratio of the beams can be controlled by neutral density filters (ND) into the BaTiO3-crystal. The grating is read by a probe beam from a HeNe-laser fulfilling the Bragg condition. An interaction between the beams is avoided by using separate lasers.
The homogeneous illumination of the crystal by the probe beam
effects the erasure of the diffractive index grating or at least
the decrease of the modulation of the grating. In order to avoid
a distortion of the results of the measurement the probe beam
was switched off during the write process. Then we measured the
intensity of the diffracted part of the probe beam after switching
on this beam. Fig.2 shows a typical temporal course. The intensity
for t=0, when the grating is undistorted, was noted.
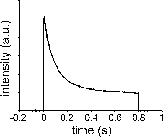
Figure 2: Temporal course of the intensity of
the diffracted probe beam
The modulation m of the intensity distribution, 
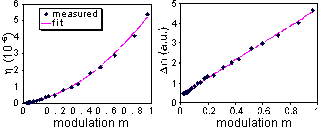
Figure 3: Influence of the modulation of the intensity
distribution
The relation shown by equation 2 is confirmed. The right diagram
gives the same result. Here, the modulation of the diffractive
index Dn as a function of the modulation
m is shown. The linear dependence is obvious. Astonishingly, the
dependencies are not only valid for small modulations m, as required
to derive equation 1, but for all the range of m between 0 and
1. Efforts to explain this result have been done in [1, 2] by
using perturbation analysis and taking higher harmonics into account.
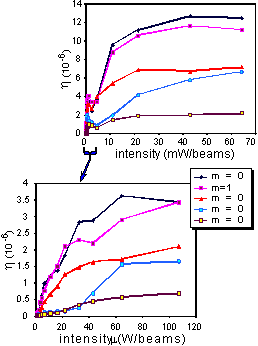
Figure 4: Influence of the absolute intensity
Iabs
In the following, the influence of the total intensity Iabs on the diffractive index modulation Dn and the diffraction efficiency h is studied (Fig.4). The intensity Iabs was varied over five orders of magnitude, between 100nW/beam and 60mW/beam (beam»3mm2).
The relation is measured for various values of the modulation
m that is used as parameter varying between different graphs.
Figure 5: Influence of the absolute intensity Iabs
(logarithmic representation)
The diffraction efficiency increases with increasing intensity. Because of the large intensity range, a logarithmic representation is shown in Fig.5.
The theory (Kukhtarev) does not explain the measured relation between Dn and Iabs. Therefore, it thoroughly seems to be appropriate to fit the measured points (Fig.5) by linear functions in order to get a first rough approximation.
Using ln (Dn) ~ ln
(Iabs) we get:
Dn ~ Iabsa
This function does not describe any physical circumstances or
relations. Nevertheless, the error in any further calculations
based on intensity dependencies is much smaller if this approximation
is used than if the dependence is ignored at all. Moreover, Fig.6
makes clear that the deviation between approximation and real
values is not too important and that the description by the derived
function is rather good.
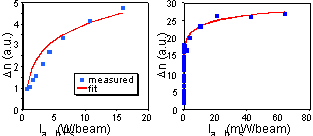
Figure 6: Fit of the derived function Dn
~ Iabsa
to the measured values shown in Fig.4 for m=0.94
Acknowledgment
This research has been partially supported by the
Deutsche Forschungsgemeinschaft (DFG) within the Innovationskolleg
"Optische Informationstechnik" (INK 1/A1) at the Friedrich-Schiller-Universität
Jena.
References